A row around Britain that doubles as a science platform
Written by: Madalena Barceló, Sustainability Solutions Trainee | Last updated: 17.06.2026
Each summer, crews in the GB Row Challenge row unassisted around Great Britain, sampling the sea continuously as they go. Across 2022, 2023 and 2024, a different crew and boat each year, that produced more than 180,000 temperature and salinity readings tracing the whole coastline.
As proud partner of the challenge, we turned these temperature and salinity readings into oxygen-holding capacity, then asked wherearound Britainthat capacity has fallen below normal.
Why we did it
The ecosystems around our coast are sensitive to exactly this: not only how warm the water is, but how much oxygen it can hold at saturation. The stretches that run warm year after year are where that sensitivity is most likely to be tested first. Identifying those specific stretches is what turns a broad concern into something that can be monitored where it counts.
We love taking complex datasets and combining them to solve important environmental and social problems. This analysis combined freely available climate data with measurements gathered during the GB Row Challenge (Fantuzzi et al., University of Portsmouth1) and hosted on the Crown Estate’s Marine Data Exchange. As is often the case with environmental and social issues, much of the data needed to understand our coast already exists, held across separate sources; the work is in bringing it together into something communities, regulators and businesses can act on.
What we measured
Oxygen-holding capacity is the amount of oxygen seawater can hold when saturated, determined by its temperature and salinity. It is a ceiling, not a measure of the oxygen actually present. Warmer and saltier water both reduce this capacity, so both are included in our calculation. As a rule of thumb, each 1 °C above normal lowers the ceiling by around 2%, although the exact reduction also depends on salinity and the conditions in these waters. The effect may seem modest per degree, but it can build over a warm summer, especially in the most affected stretches.
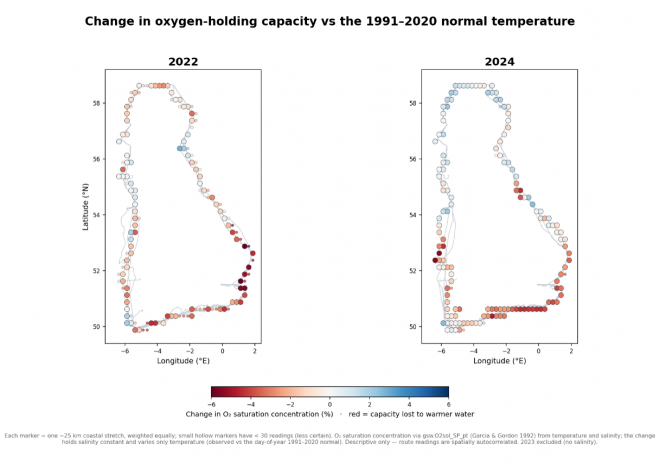
For 2022 and 2024 we calculated oxygen-holding capacity from the temperature and salinity readings by applying the standard oceanographic formula (Garcia & Gordon, 1992). We also calculated a baseline capacity at the locations’ 1991–2020 normal temperature for that day of the year, from NOAA’s long-term record. We held salinity constant at the 2022-24 level deliberately so that the difference in capacity is that gained or lost purely because the water was cooler or warmer than normal.
Where capacity slipped below normal
Grouping the readings into stretches of roughly 25 km, the pattern is clear. Where the water ran warmer than normal, capacity fell. Across all stretches the typical change was around 1% lower, but in the warmest patches it reached 8% — for example off the Norfolk coast in 2022. A few cooler than normal stretches in the north and Scotland showed the opposite pattern: where the water ran cooler than normal, the ceiling rose. The same relationship between temperature and capacity running in reverse, with cooling lifting the saturation ceiling. A lower ceiling is not a reading of how much oxygen was present; actual oxygen also depends on mixing, respiration and stratification. What we map is the change in the ceiling: the headroom available to the species that depend on it.
The map covers 2022 and 2024. Capacity needs both temperature and salinity, and salinity was not recorded in 2023, so the warmest year is the one we cannot compute.
To put these findings is context, the IUCN2 estimated in 2019 that the ocean’s oxygen content had declined by 2% since the mid 20th century. Therefore, the change in estimated oxygen-holding capacity estimated here over a much shorter period is significant if it becomes a trend. The same IUCN report explains that while the long-term impacts on human health, society and the economy are uncertain, it is known that the impacts on marine biodiversity and ecosystems will be severe.
The warmth is uneven — and some stretches repeat
In 2024, southern stretches ran 1 to 2 °C above normal while parts of north-west Scotland sat slightly below it. In 2023, the year we cannot compute, was the standout: about 65% of the route was warmer than its local marine-heatwave threshold (the 90th percentile for that place and day of year), against 47% in 2024 and 36% in 2022, in line with the well-reported 2023 North-East Atlantic heatwave.
The recurring stretches matter most. Of the 83 stretches sampled in all three years, about a third were warmer than normal every year, clustering along the English Channel and the south coast. Off West Sussex, the water ran 2 to 3 °C above normal each year. These are the places repeatedly operating with less oxygen capacity and therefore are most likely to see lower actual oxygen levels.
Curious to know more?
Know more about our Nature risk services or get in touch with us to arrange a meeting with one of our experts to explore the next step in your sustainability journey.
Methodology, in brief
Oxygen-holding capacity is the dissolved-oxygen saturation concentration from temperature and salinity (gsw/TEOS-10 O2sol_SP_pt3, Garcia & Gordon, 19924). The capacity change holds salinity constant and varies only temperature (observed versus the day-of-year 1991–2020 normal); fixing salinity at 35 PSU reproduces the same pattern. Because the crews sampled around the clock, each reading is also de-biased for the daily temperature cycle by subtracting the dataset’s own average time-of-day anomaly (amplitude ~0.5 °C). Each ~25 km stretch is weighted equally, so heavier sampling in 2024 does not bias the comparison; stretches with fewer than 30 readings are flagged as less certain. Temperature anomalies use the NOAA OISST 1991–20205 daily normal; marine-heatwave conditions follow Hobday et al. (2016)6. Estuarine readings below 30 PSU are excluded. Differences are descriptive, not significance-tested; three years describe interannual variability, not a long-term trend.
For me, the real value of this research is the shift from broad climate trends to specific places, made possible by data gathered in unique conditions. Using readings collected during an unassisted row around the UK to map where oxygen capacity is repeatedly reduced lets us focus attention on the coastal ecosystems that may need it most.”Madalena BarcelóSustainability Solutions Trainee
Impacts and dependencies
We help you understand how your business impacts the world around it. And what it depends on. So you can manage risks, uncover opportunities, and make smarter, more sustainable decisions.
Sustainability can be a complex landscape, we work with your organisation to fully equip your employees and stakeholders with the necessary skills and knowledge so everyone can engage in your strategies.